Observability is the process of understanding the where, the when, and the why behind how your application behaves. It relies on instrumenting the details that matter – the signals your systems emit as they operate. Simply put, observability is a combination of three things.
Many people confuse observability with monitoring. Monitoring tells you that something happened, usually through alerts. It’s a start, but it’s not the whole picture. To understand the full scope of the what, when, and why, you need observability.
In order to understand the full scope of the what, when and the why, you need to implement Observability.
Number 1 is Logs – the most straightforward piece of data. It is a chronological order of events.
For example, you have an event about a customer adding an item to the cart. Clicking the button to proceed to check out, is another event. Hovering over the price, adding the zip code to calculate taxes is another event, and going back to Continue Shopping is another event.
Logs simply keep track of what was happening at each step. This is the What. Logs have one big problem – they are storage hungry. One strategy is to aggregate, and index only keywords and not the entire log, so they are easier to query.
Number 2 is Metric. Metrics are numerical snapshots at a point in time. So, they are good for understanding and creating thresholds and guardrails. They are also good for creating time series analyses to see how the metric changed over time. However, because they are just numbers, there is no context, and you want something else, in order to get the context. Something like Logs, or Traces.
Number 3 is Traces. Think of traces as the record of the path of a single request as it moves through the system. Each time it lands on a system, it is a span. For example – a database query, an API call, a cache lookup. Think of it like an uber level stitching of the logs put together. It is the most mature way to tell you where it happened. Tracing requires both storage and compute. however, for your business critical resources, this is your way to go.
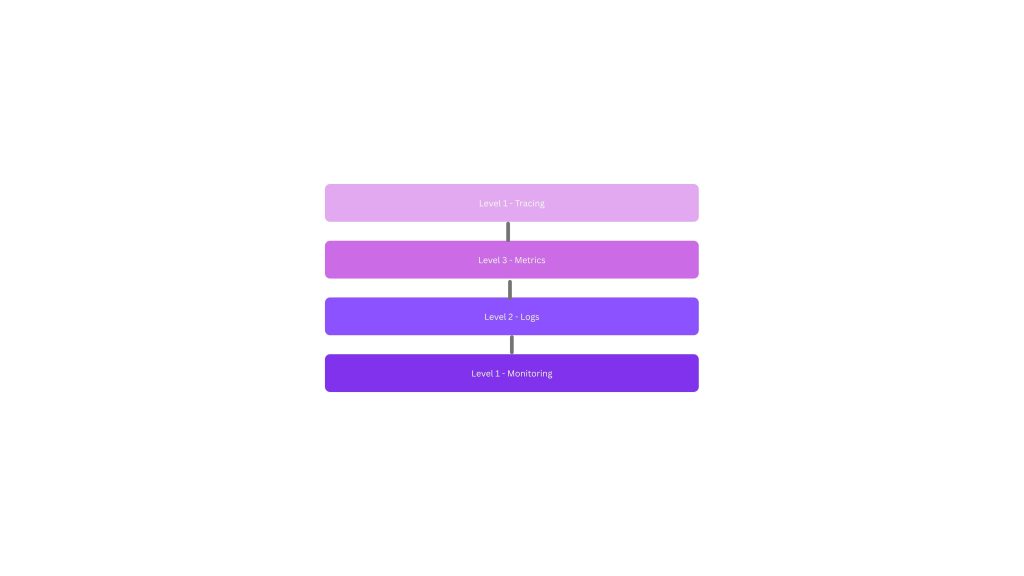
If you were to build a maturity model, it would be something like this.
Monitoring would the first level. followed by Logs, followed by Metrics and then finally Tracing.
The standards of today are defined by the OpenTelemetry framework. OpenTelemetry (OTel) is the backbone of modern observability, but it took some time to get here.
Before OTel, the industry was fragmented. Every vendor had its own SDKs, agents, formats, and APIs. Teams had to choose between OpenTracing (focused on distributed tracing) and OpenCensus (focused on metrics and stats). Both were open source, both were widely adopted, and both were incompatible.
In 2019, the CNCF (Cloud Native Computing Foundation) brought the two projects together under a single vision: a unified, vendor‑neutral standard for collecting logs, metrics, and traces.
OpenTelemetry became that standard.
Since then, it has grown into one of the largest and fastest‑moving CNCF projects, second only to Kubernetes. Today, OTel provides:
- A single instrumentation standard
- A consistent API and SDK across languages
- A collector that decouples data generation from data export
- Support for logs, metrics, traces, and emerging signals like profiles
OTel’s mission is simple: Make telemetry portable, consistent, and future‑proof — no matter which tools you use.
This is why modern observability strategies increasingly start with OpenTelemetry, not proprietary agents.
So, now all Observability vendors are tuned to the OTel standards, which makes switching or implementing so much easier.


Leave a Reply